REACH OUT IN ANY OF THESE 👇🏻
🚀 Who am I?
'Every piece of data has a story to tell.'With over 18 years of experience in the dynamic realm of the gaming industry, I consider myself an extremely versatile, results-driven data analyst. Armed with an extensive skill set and a keen analytical mind, I have consistently contributed to the success of various game and console releases, guiding the wider team with data to help them make informed decisions for their products. Proficient in a spectrum of data visualisation and analysis tools, including Qlik, Tableau, SQL, Looker Studio, Power BI, and Python, I take pride in possessing a versatile toolkit to unravel complex datasets and derive actionable insights.Whether it's dissecting player behavior trends, forecasting our financial year budget and game sales, or enhancing user experience, I have been at the forefront of leveraging data as a powerful asset in shaping the gaming landscape.Beyond technical expertise, I bring a passion for innovation, a collaborative spirit, and a commitment to staying abreast of the latest industry trends. I am not just a data analyst but a strategic partner, adept at aligning data initiatives with overarching business goals. In the ever-evolving world of gaming, it is paramount to stay at the vanguard and use the power of data to invigorate the decision-making process in every company.
🏢 SOME OF THE COMPANIES I WORKED WITH
🔧 MY TOOLKIT
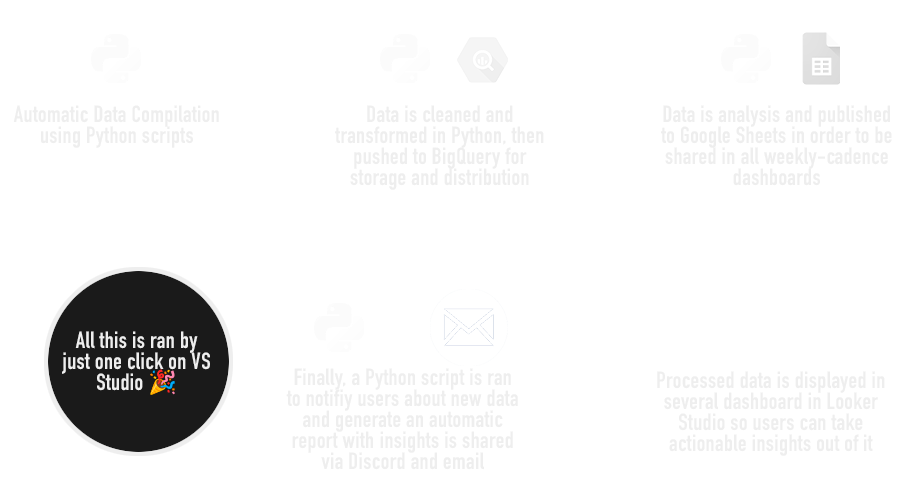
I possess proficiency in various tools and make a conscious effort to expand my skill set annually, given the rapid pace of data analysis and development.In addition to diligently fulfilling my responsibilities, coding and programming are not just tasks for me; they are my passions. This enthusiasm is evident in Finanzas MTG, a project that originated as part of my portfolio. It has since evolved into a revenue-generating venture and transformed into a full-stack data-processing tool. This tool automates data gathering on a weekly basis using Python scripts, stores the data in BigQuery, and channels it into Looker Studio for visualization. Moreover, the data is processed with Python to automate posts on Twitter or send emails to our users.
🎓 MY DATA ANALYTICS CERTIFICATES
Some of the courses and certificates I finished in the past.
❤️ THE POWER OF GIVING BACK
Giving back to charities is crucial for several reasons. Cancer Research UK contributes to the ongoing battle against a pervasive and devastating disease, funding vital research that can lead to breakthroughs in treatment and prevention. Special Effects, dedicated to helping individuals with disabilities through video games, relies on charitable contributions to enhance the quality of life for those facing unique challenges, emphasising the importance of inclusivity. The National History Museum serves as a beacon of education and preservation, in the vanguard of educating future generations about the wonders of our planet's past. Last but definitely not least, the WWF plays a pivotal role in conservation efforts, safeguarding endangered species and ecosystems.By donating to these charities, I aim to actively participate in global initiatives addressing health, inclusivity, education, and environmental sustainability. Together, we can create positive change for the benefit of society and the world we inhabit.
🐱 DEXDECK.COM
In my professional life, I operate as a data analyst and engineer within the gaming industry, where I have spent over 18 years managing complex datasets and forecasting trends. My day-to-day work is defined by precision, enterprise-scale logic, and the use of tools like Python and SQL to drive business decisions.DexDeck, however, was born from a much simpler, more nostalgic necessity. The concept emerged at a Christmas party when a close friend admitted they could not distinguish Squirtle from Bulbasaur. I realised that the encyclopaedic knowledge I had built up since my childhood—starting with a grey Game Boy and Pokémon Red—was a language they did not speak.This project became the bridge between those two worlds. It is the first game I have coded entirely by myself, transforming the raw data of Pokemon into a tribute to the Top Trumps battles of my school days. More importantly, it is a legacy project for my family. My wife and I have spent countless days playing Pokémon Go on walks from Battersea to Richmond, and DexDeck is my way of passing that sense of adventure on to my daughter. It proves that data is not just about business forecasts; in the right hands, it is about capturing memories and sharing the things we love.Click below if you want to learn more about Pokemon or play some games!
📈 DATA STORYTELLING & VISUALISATION
With the rise of digital business and data-driven decision making, data storytelling has become a cornerstone skill for any organisation. Translating sophisticated data analyses into plain-English is paramount to provide stakeholders with valuable insights to propel the business forward. By simplifying and digesting billions of rows of complex data into an easy-to-understand chart, we empower our colleagues to make powerful and tailored decisions.Data visualisation and data stoytelling gives anyone, regardless of level or skill set, the ability to understand and use data in their jobs every single day. Therefore, using data in an organisation should not be the goal – it should be part of the culture.
This Looker Studio dashboard showcases full-stack data processing – data is ingested via Python with web scraping, then normalised – cleaned, aggregated, additional calculated fields – and loaded into BigQuery (SQL Database). Lastly, via custom queries, data is pipelined into the dashboard for visualisation. The dashboard can be filtered by users and it’s completely dynamic – it’s updated automatically every 12 hours with new data.
This Tableau dashboard shows a snapshot of an analysis on Pokémon Total Power. The data used is from Kaggle and includes information from every Pokémon from Generation 1 through 7. The raw data was processed in order to clean it, normalise it and add calculated fields used in the analysis, including the Total Power metric. The goal of the dashboard is to find a correlation between a Pokémon Total Power and other traits – Legendary condition, size or Type.
📈 CASE STUDY: RESERVED LIST IN EUROPE
📈 CASE STUDY: POKÉMON POWER CORRELATION
🤖 { MACHINE LEARNING: PLAYER SENTIMENT }
In this GitHub repository you will find a machine learning project. The goal is to predict if a review of a game is negative or positive using an SVM model. You will find the training data and an additional, independent testing dataset to try the model.There’s no need to run the script to get the model – you can download it directly from the ‘data’ folder, load it with your favourite Python IDE and test it with any text you want.
📦 { MONTE CARLO SIMULATION #1 }
I have developed this MTG Box Generator is used to calculate estimated value of boxes for different sets. It uses modelling for statistical analysis and helps users to gauge if the retail price of a box compares positively with the potential cards inside each booster pack. This is key to understand how the market develops in the first few weeks after a new release.You can find the latest version of the Box Generator and the data to run it in my GitHub repository.

🤖 { DISCORD BOT FOR MTG MARKET DATA }
With automation and AI being a very important part of the future's workplace, this Discord bot provides the users of Finanzas MTG with a self-service method to pull information from my database.The bot called Lilibeth, the Thraben Inspector has several features:
- Provides detailed instructions on how to use the tool via an intuitive interface with buttons and simple commands
- Deliver a list of the cards available to query and their sets
- Replies with simple data on how cards are performing in the market, including minimum price, trend price and stock
- Creates and distributes Excel files if multiple datapoints are requested from the user
- It is able to send a suggestion if the name of the card is slightly wrong, or if the date is not available
🦊 { STREAMLIT APP - KITSUNE CODEX }
Kitsune Codex is a web application crafted on the Streamlit platform, tailored specifically for Magic: The Gathering (MTG) enthusiasts who are passionate about managing, analysing, and optimising their card collections. Whether you're a seasoned investor or an avid collector, this innovative tool combines powerful functionality with an intuitive design to simplify portfolio management.Leveraging data visualisation technologies and seamlessly integrating weekly market data from Cardmarket – Europe's leading MTG marketplace – Kitsune Codex empowers users with a comprehensive view of their collection's performance. The app provides an array of features, including tracking market trends, evaluating portfolio value, and offering actionable insights to make smarter decisions.Designed with both practicality and ease of use in mind, Kitsune Codex bridges the gap between sophistication and simplicity. It is more than just an application; it is a trusted companion for every MTG enthusiast looking to navigate the dynamic world of trading cards with confidence.You can visit Kitsune Codex here and use 'Demo' as username (with an empty password) to check it out!

💰 FINANZAS MTG
Finanzas MTG was born as a simple data science project where I would gather data on Magic: The Gathering cards and predict price movements based on available stock of those cards. The initial goal was to include it in my portfolio, to showcase my programming and analysis skills. However, it has since evolved into a revenue-generating venture and developed into a full-stack data-processing tool that serves thousands of users every week.The ETL process put in place automates data gathering using Python scripts to compile and clean data from different websites. It is then stored in BigQuery for easy access and processing. Finally, the data is funnelled into Looker Studio to deliver striking visualisations and extract actionable insights - this way, users will understand a bit better if it's time to buy, hold or sell their MTG singles or sealed product. Moreover, the data is processed with Python to automate posts on Twitter or send emails to our users.
The Magic Behind Finanzas MTG


